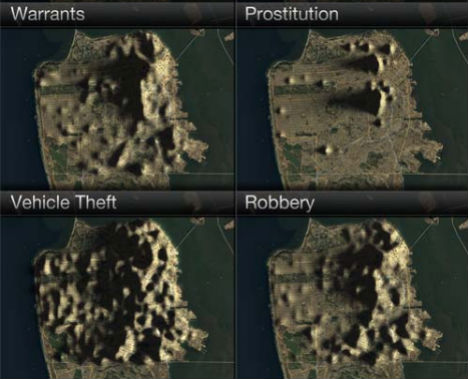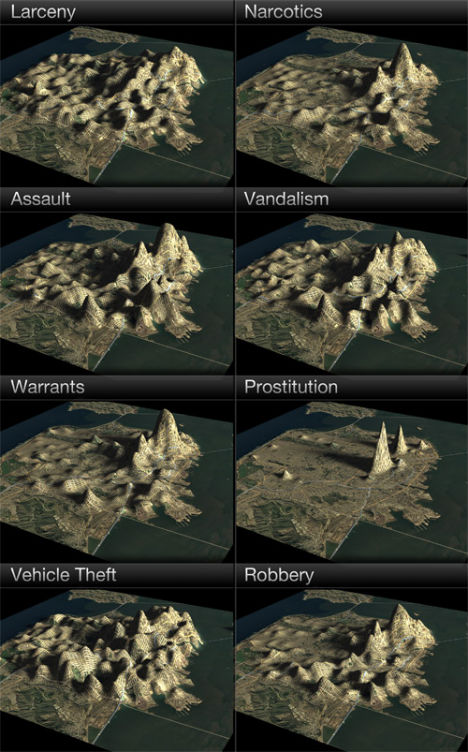
Who knew that San Francisco had a mountain called ‘Prostitution Peak’? Such hidden ‘landscape features’ are revealed when the city’s crime statistics are analyzed as a 3D topographic map.
Data visualization engineer Doug McCune shows how the city’s notorious hills can shift according to the type of crime, from larceny and vandalism to robbery and assault.

With the glow of the sunrise in the east, the hills and peaks cast shadows over much of the city, and some streets are revealed to be consistent ‘ridges’ in nearly all types of crime, including Shotwell Street – which, incidentally, is the location of the biggest concentration of prostitution busts.

The maps make it easy to see how certain crimes are distributed across the city; while drugs appear to be mostly limited to the northeast slice of the city bordered by Van Ness and Market Streets, vehicle theft is pretty widespread. If only navigating the real-life topography of San Francisco were this easy: as the hills get steeper, you’re more likely to fall victim to a crime.

But don’t take the maps too seriously. McCune does offer a disclaimer: “These maps were generated from real data, but please don’t take them as being accurate. The data was aggregated geographically and artistically rendered. This is meant more as an art piece than an informative visualization.”
0 comments:
Post a Comment